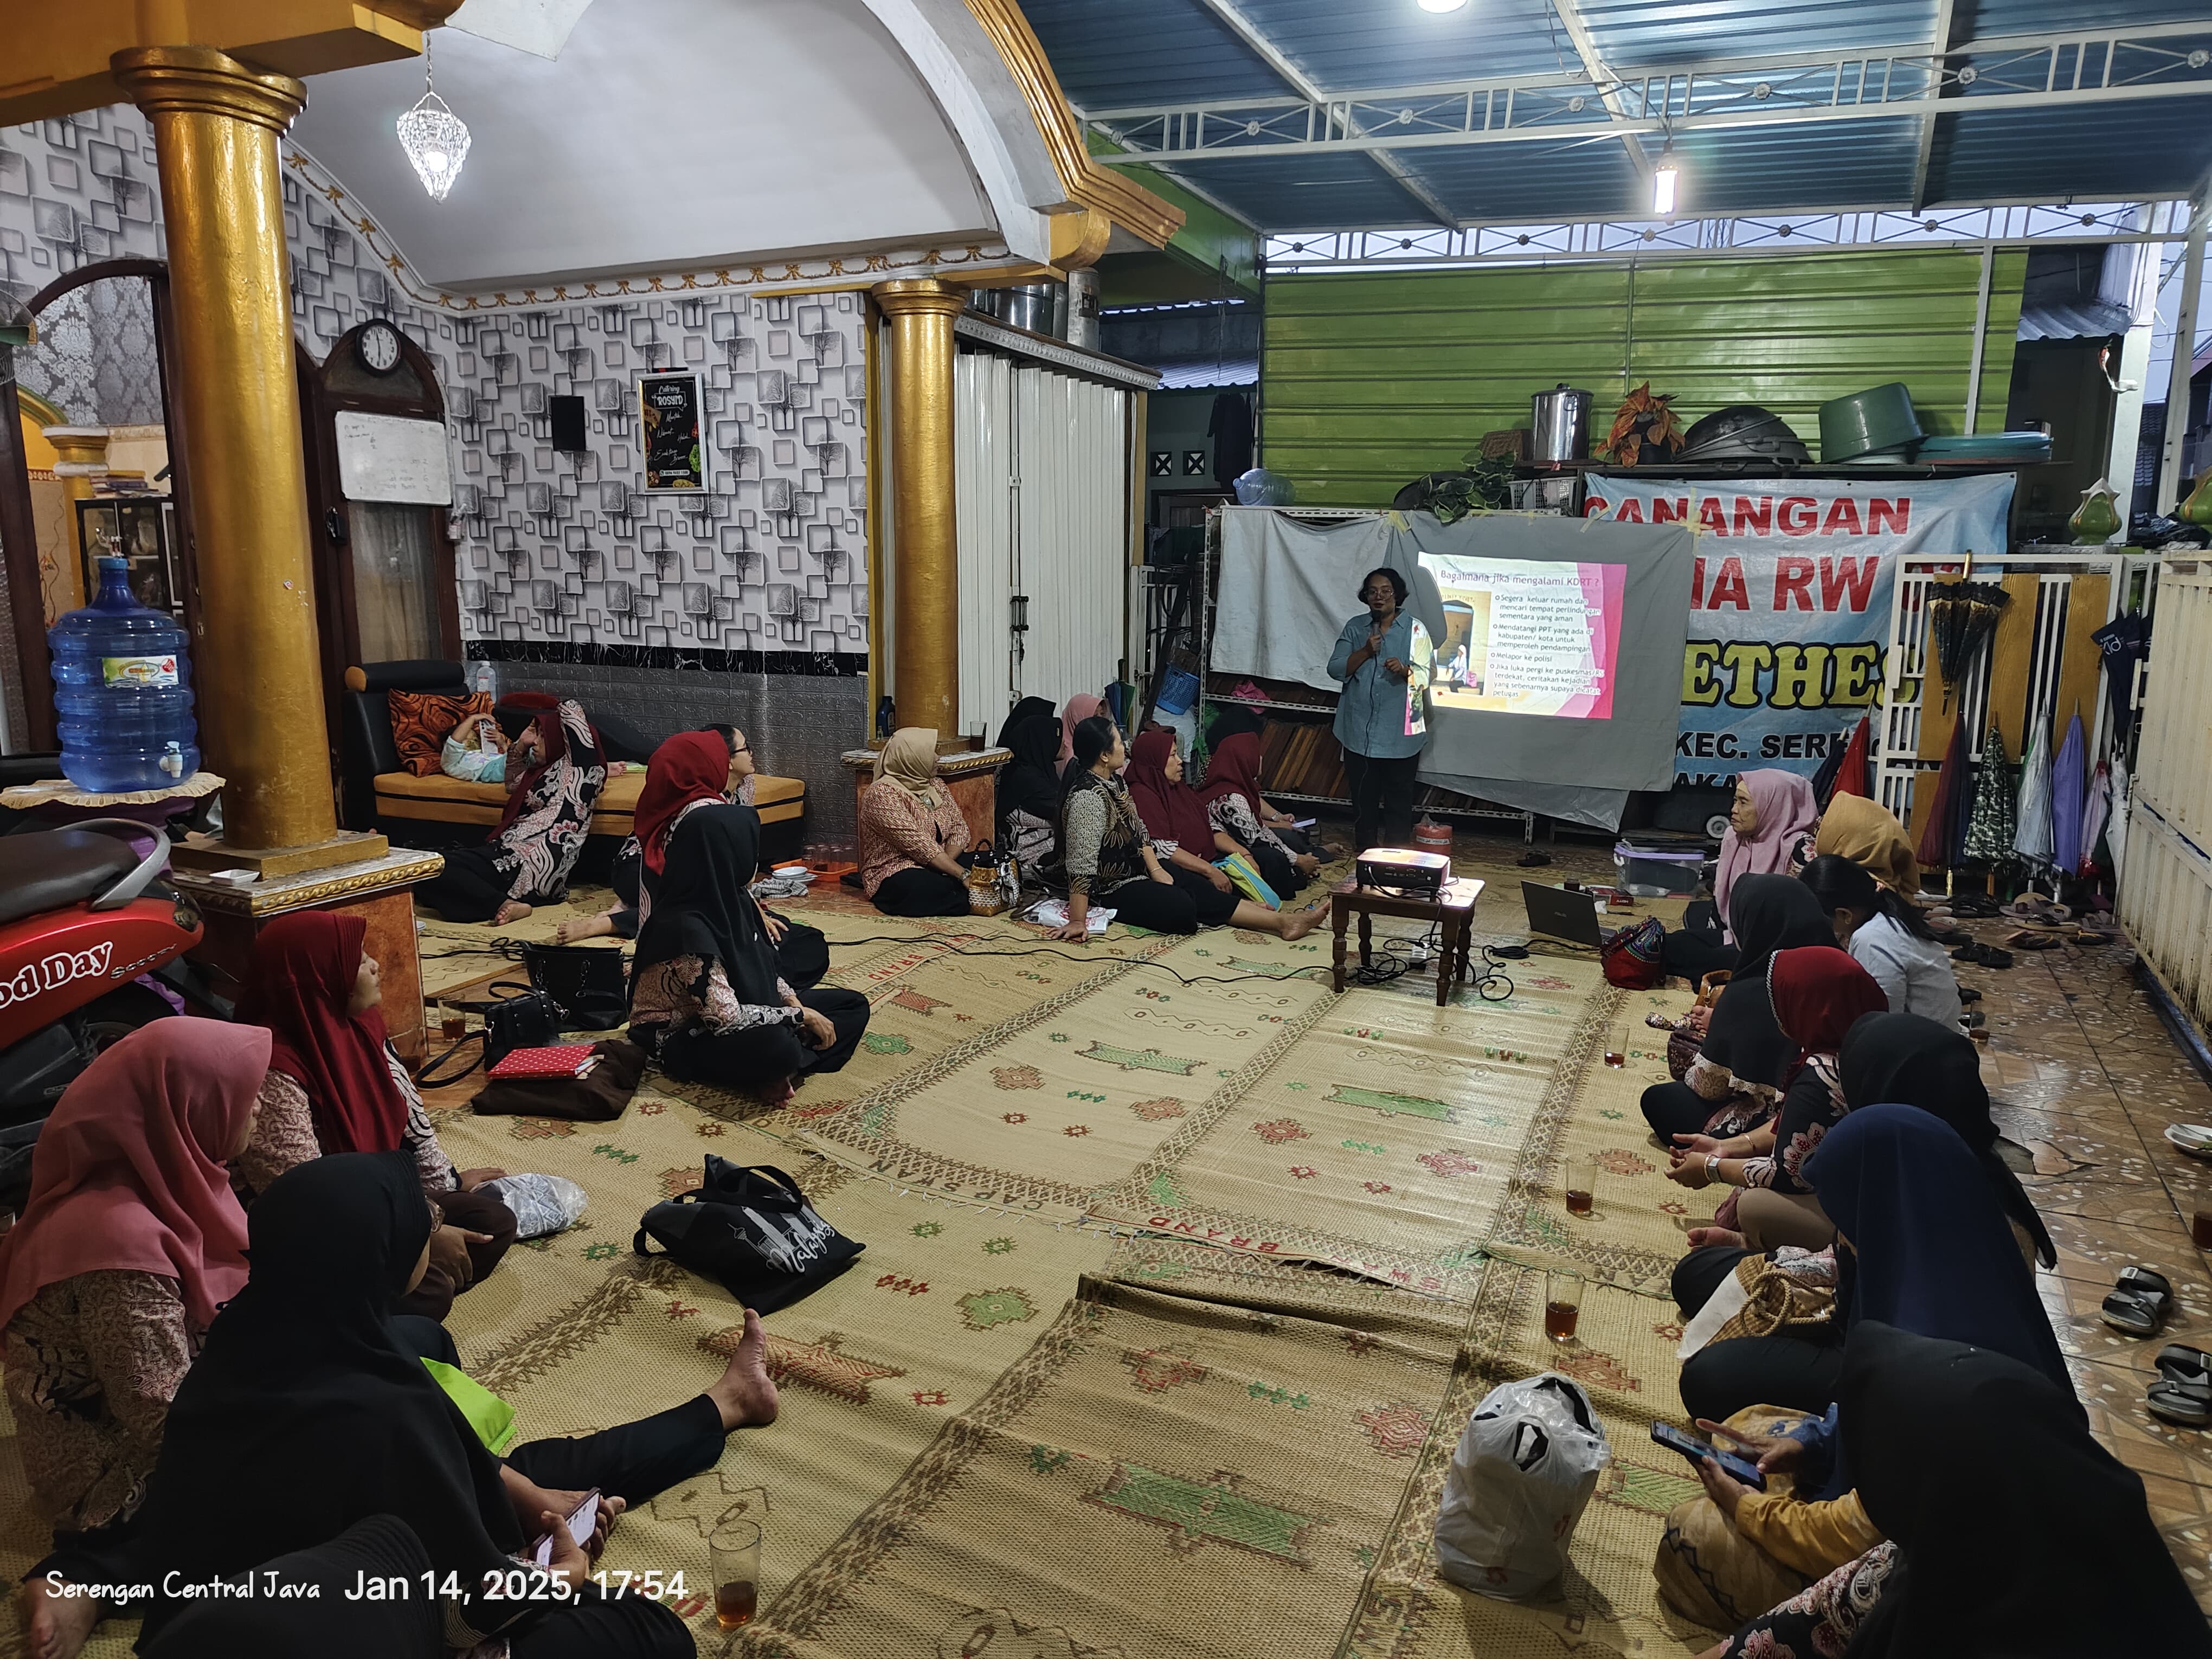
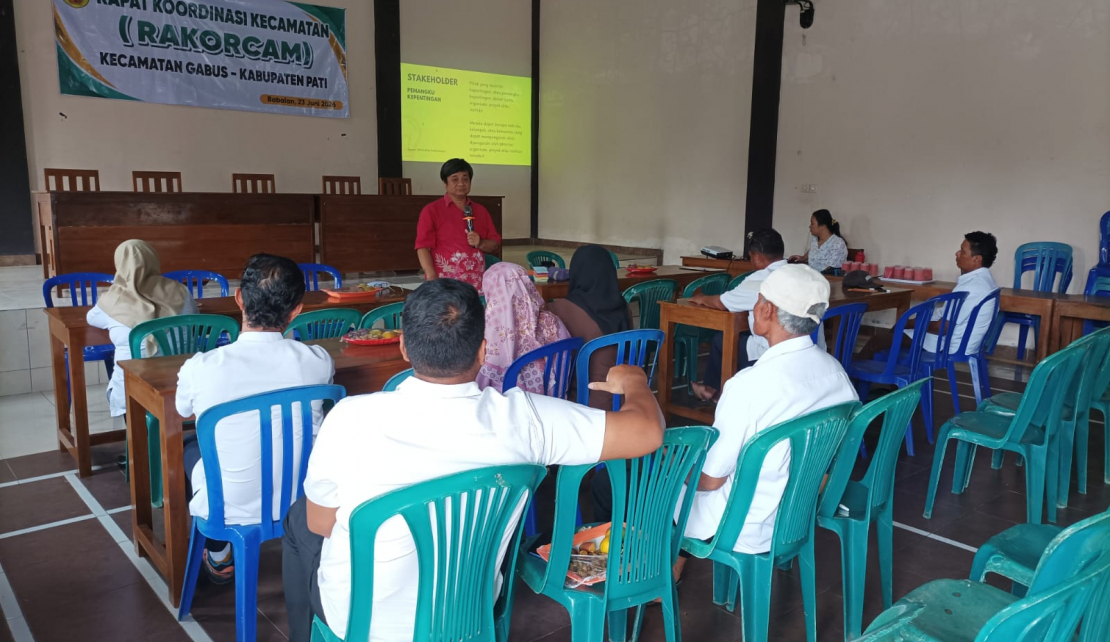
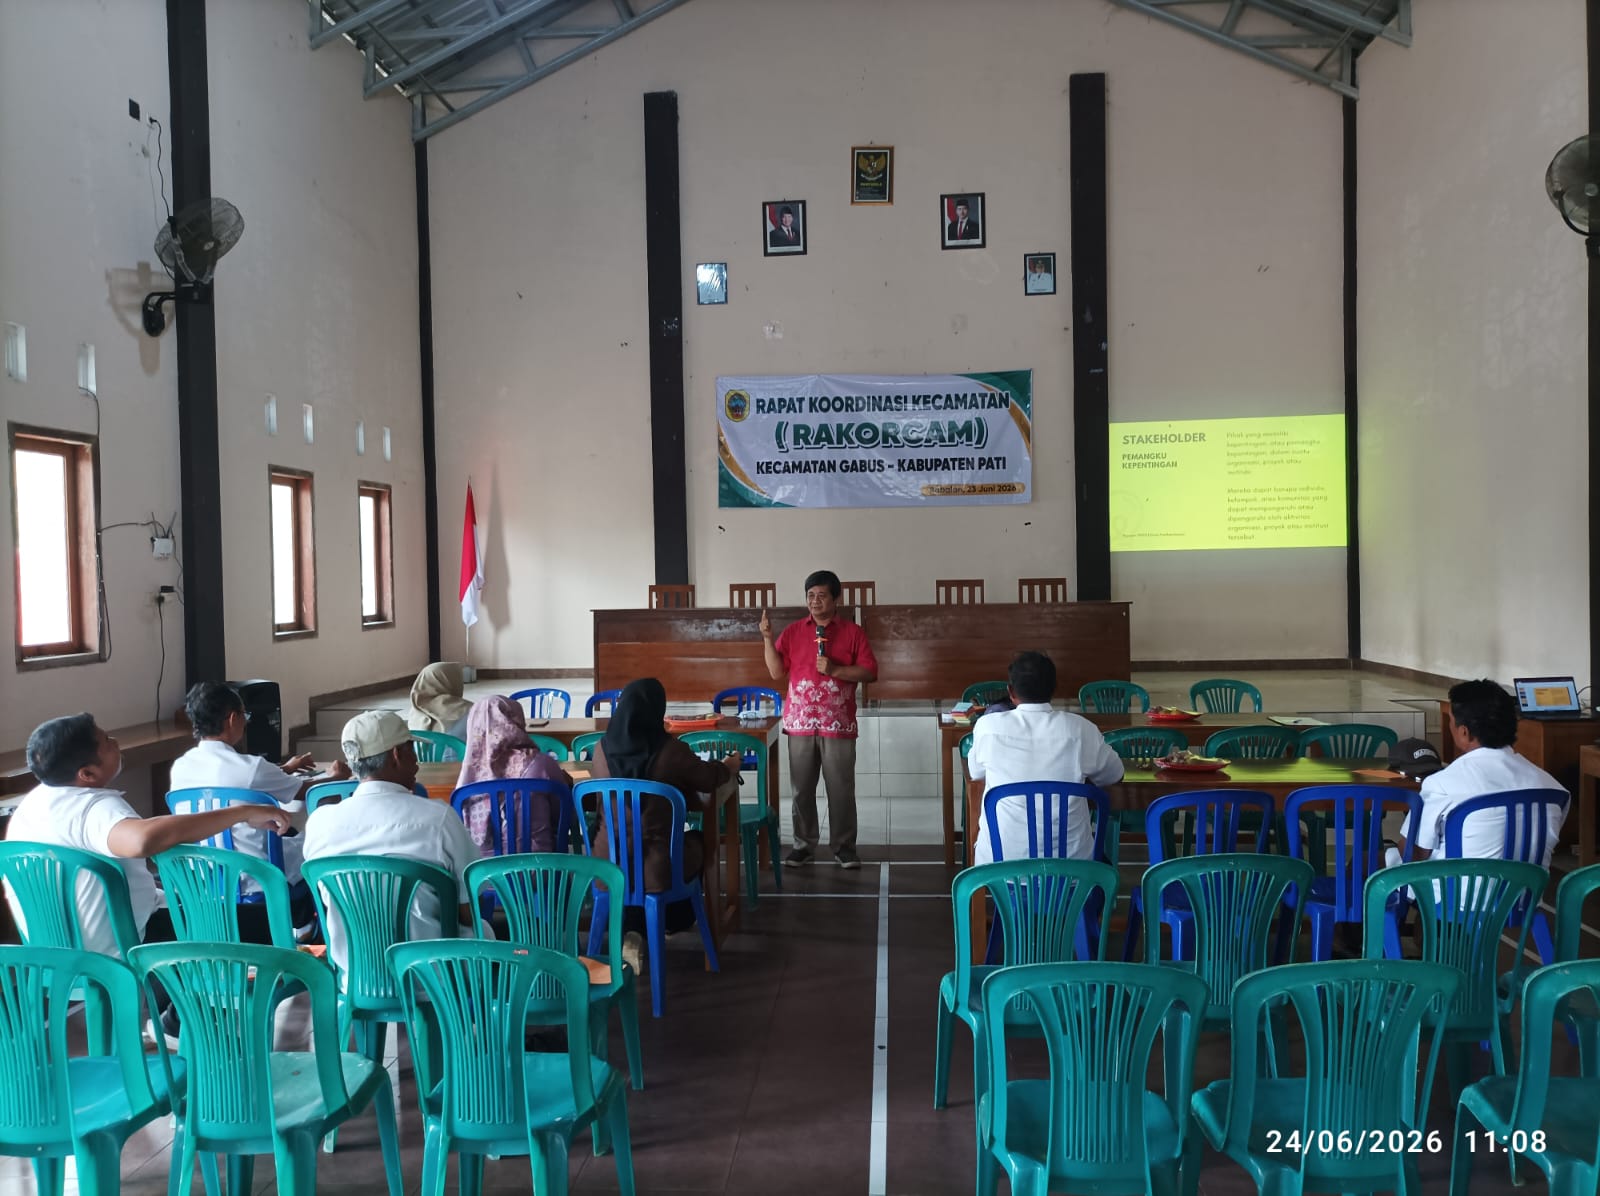
This was why understanding stakeholders was critical. Adi explained that stakeholders were parties who had interests or influence in an organisation, program, or resolving specific case.
To make it easy for participants to understand, he offered a few examples of stakeholders in the closest vicinity of the victims - families, schools, village governments, service providers, and community organisations. Participants then identified a number of sectors and parties involved.
In the process, Adi emphasised that stakeholder mapping should not be conducted in general terms, or just by mentioning major institutions. What was critical was identifying specifically the parties with biggest influence to solving the case.
“We must be able to identify who is most influential to the issue at hand,” he said.
He said that after the stakeholders were identified, the next action was to build good relations and communication with them. Strong relation with stakeholders would expand the opportunity for success in advocacy to resolve the case.
Adi then explained the stakeholder mapping stages. The stages included identification of stakeholders, stakeholder analysis, stakeholder mapping, and stakeholder management.
In the explanation, he introduced a diagram used to understand the positions of each stakeholder based on two key aspects – level of interest and level of influence. In the diagram, the horizontal line showed level of interest, while the vertical line showed level of influence.
Each aspect was divided into three categories – high, mid, and low. By using such analysis tool, participants knew whether a given stakeholder tended to support, to be neutral, or even to oppose advocacy.
The method, according to Adi, was critical to help prepare strategies in order to define the rights approach for every party involved.
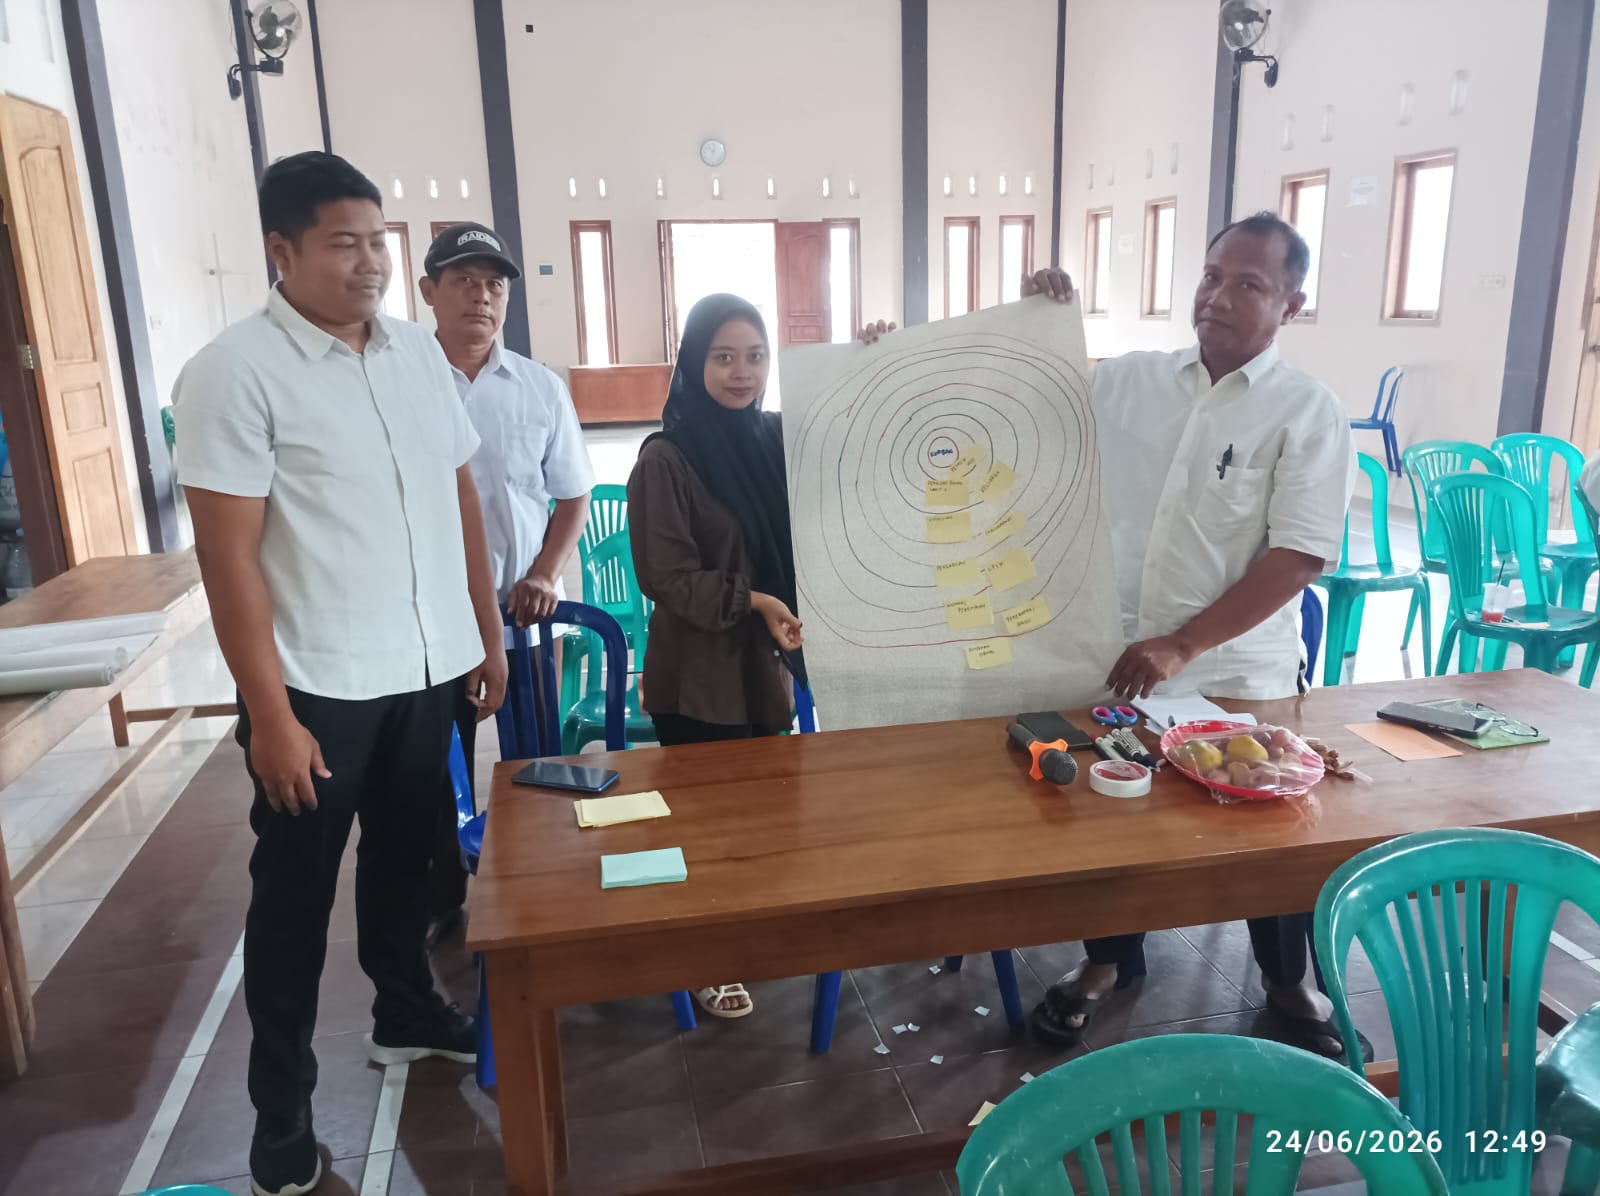
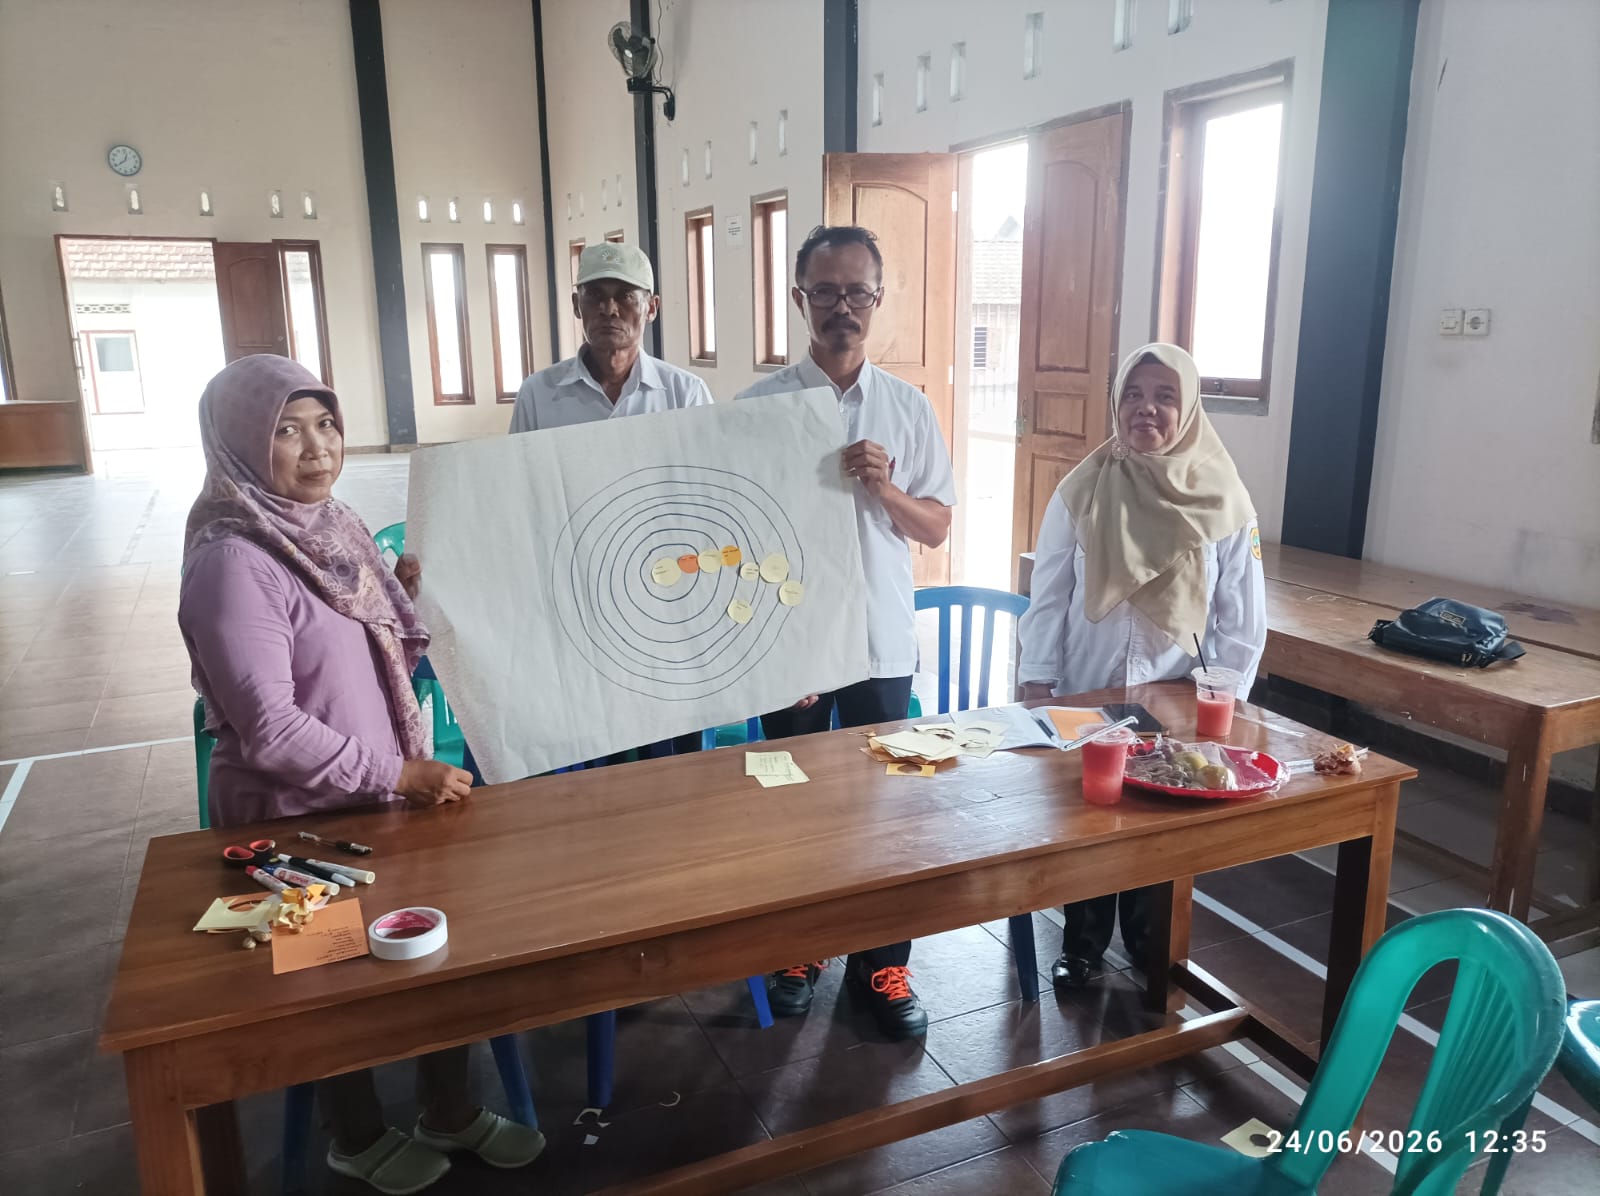
After the theoretical explanation, participants not only listened. They were prompted to practice the stakeholder mapping technique through Venn Diagram.
Participants were divided into two groups. Each group was tasked with choosing a case of violence against women and children it wanted to analyse. After choosing a case, the groups then prepare stakeholder lists, starting from the nearest groups to victims to those with biggest influence to resolve the case.
In such practice, the size of the circle in the Venn Diagram illustrated the size of each stakeholder towards resolving the case. The position of the circles showed, in the meantime, how close was the relationship was with the victims and the case being managed.
Group discussion proceeded in a dynamic way. Participants exchanged views about parties they wanted involved in the management of cases of violence.